the minimum wage and unemployment (and gdp)

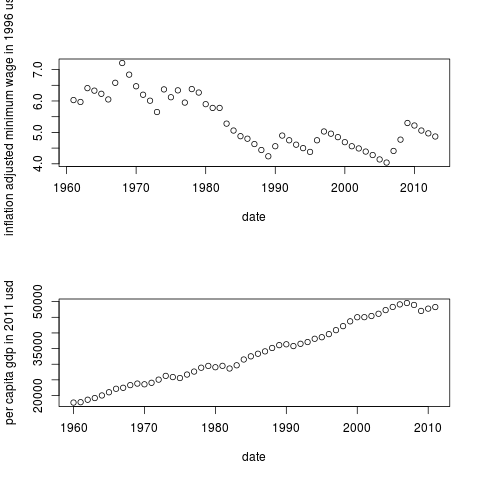
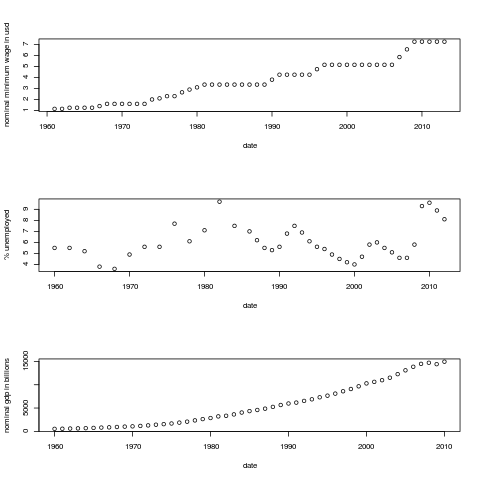
with current debates over raising the minimum wage, the experts are weighing in on whether or not there is an impact on unemployment. the following graphs present relevant data from 1960.

min

the minimum wage data comes from infoplease, as does the unemployment data. the gdp data is from usgovernmentspending.

these statistics are in nominal values, since that is perhaps relevant to the psychological impact of minimum wage wages. below, inflation adjusted values are presented.

actually, gdp doesn’t seem to tell us much since it basically just goes up, but i left it in for comparison anyways.

on the other hand, there does appear to be a face value correlation between minimum wage hikes and unemployment surges. for instance, in 1967, the minimum wage was raised to $1.40, and then the following year to $1.60. From ’66 to ’68, unemployment dropped from 3.8% to 3.6%, but by 1970, it had jumped to 4.9. From ’74 to ’81, the minimum wage was further raised from $2 to $3.35 and unemployment continued to rise to 7.7 in ’76 and even 9.7 in ’82. in ’91, the wage was raised to $4.25 and unemployment jumped from 5.6% to 6.8 and then even 7.5 in ’92. In fact, from 2006 to 2009, the wage was hiked from $5.15 to $7.25, while unemployment skyrocketed from 4.6% to 9.3. i’m actually a bit surprised i’ve never heard anyone blame the minimum wage raises for the great recession.

on the other hand, there were raises in ’61 (from $1 to $1.15) and ’63 (to $1.25) while unemployment actually dropped from 5.5% to 3.6 (in ’68), and ’96 and ’97 (from $4.25 to $4.75 to $5.15) while unemployment dropped from 5.6% (in ’95) to 4% (in 2000).

that kind of seems like around 4 examples of negative effects compared to 2 contrary examples.

but all that said, there is NO long-term effect on unemployment since the wage keeps going up, but unemployment returns to its rough mean. so though the critics of minimum wage raises may have a short-term point, i will continue to assume that in the long-term, it helps people who are just barely scraping by, scrape a little less roughly.

of course, as the chart below shows, in real purchasing power, the minimum wage has actually been falling since 1968, which one could possibly try to attribute some employment increases to (maybe in the ’80s?). of course, what good is employment if it doesn’t provide a livable wage?

regarding real per capita gdp, one can see plateaus in growth around 1970, 1975, 1980, 1990, 2000, and pre-2010. one might even be tempted to blame some of these on the minimum wage increases, but again, nothing has really stopped the inexorable growth of this gdp.

realmin

the minimum wage data again comes from infoplease. the gdp data comes from the st. louis fed.

Posted in Uncategorized | Leave a comment

tax, spend, employ

Though they may bicker about particular efficacies, the long-standing agreement of liberal and conservative economists on increased spending and reduced taxes to stimulate sluggish economies make recent trends towards slashed budgets and escalating levies in the midst of dire financial straits particularly shocking.

However, before jumping to any conclusions about the stupefying idiocy of the masses and the slavish dogs who pretend to lead them, we would presumably do well to verify the validity of the above noted conventional wisdom. Though the evidence is not entirely inspirational, it does suggest marginal employment improvements with spending after about 3 years, and lower taxes after 2 years.

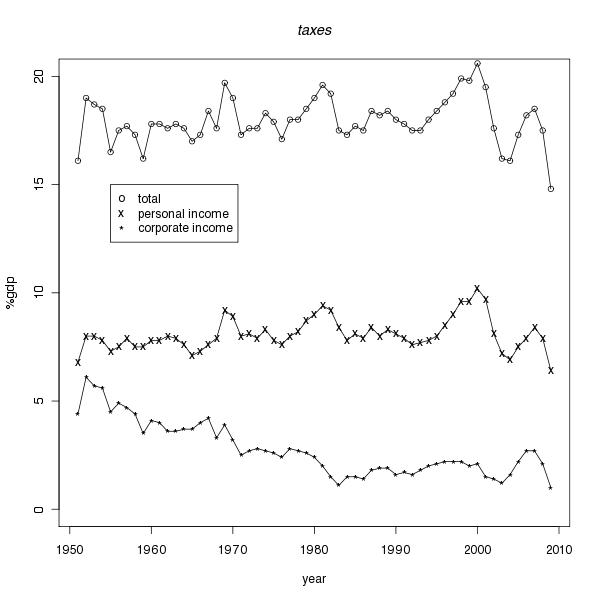
A glance at the initial data indicates that spending as a percentage of GDP has steadily increased over the last 50 years, while taxes are at the bottom of their long term range (with corporations having seen an especially favorable long-term trend), while unemployment is back where it was in the early Reagan years. One might note that unemployment variance was somewhat lower prior to 1970 (1.32 vs 2.29). Furthermore, comparing a rising trend with a range-bound variable with a bimodal distribution is hardly promising to begin with.

(The data on spending came from http://www.usgovernmentspending.com/us_20th_century_chart.html; the data on taxes from http://www.taxpolicycenter.org/taxfacts/displayafact.cfm?Docid=205; and the data on unemployment from http://www.bls.gov/cps/prev_yrs.htm)

Corporate income taxes did bottom in the early 80’s just as unemployment was surging to unprecedented levels, but then unemployment fell steeply for most of the next 20 years, perhaps validating trickle down reasoning, though corporate income taxes were slowly rising at the same time, and the new millennium came in with dropping corporate taxes, but surging unemployment, followed by surging taxes and increased employment. Since 2010, there appears to have been a clear inverse relation between corporate income taxes and unemployment: their taxes went down, up, and down, while unemployment went up, down, and up, but which set the precedent? Unemployment bottomed in 2000 (at 4.0%), peaked in 2003 (6.0), again bottomed in 2007 (4.6), and is now at historic heights (9.6). Corporate income tax peaked in 2000 (at 2.1% of GDP), bottomed in 2003 (1.2), peaked in 2007 (2.7), and now is at historic lows (1.0). Perhaps that’s over-active government adjusting policy as quickly as it sees the slightest result before corporations even have a chance to embrace the warmer climates, but nonetheless unemployment climbed through tax drops and and dropped through tax rises. Thus far, corporate threats of tax flight and lures of tax break stimulated job creation look hollow, but this issue will have be be considered more precisely after examining the overall tax burden as well as the general issue of government spending.

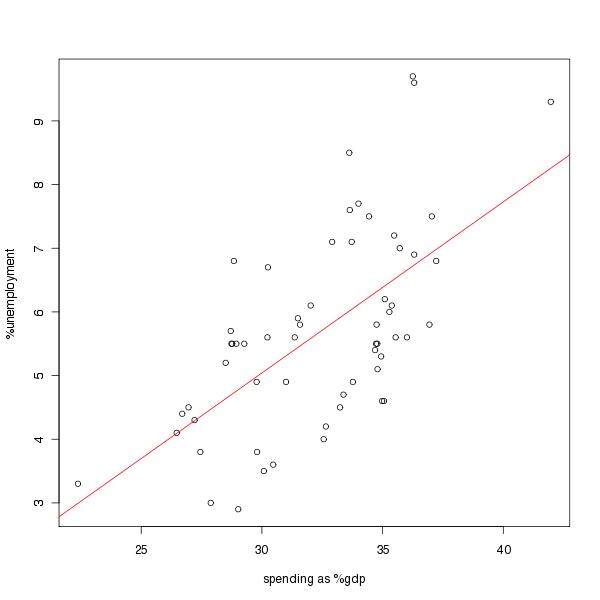
The following graph shows the strong correlation between spending and unemployment. Pearson’s r=.62 (linear regression slope=.27, intercept=-3.02). But we would hope to show that HIGHER spending DECREASES unemployment! Of course, as simultaneous factors, the relationship shows little more than the fact that government policy has generally been to increase spending during times of high unemployment. It would make more sense to treat unemployment as the independent variable and spending as the dependent result, but we may hope to remain focused on affecting unemployment. To do that, we will have to consider temporal relations of our factors, as below.

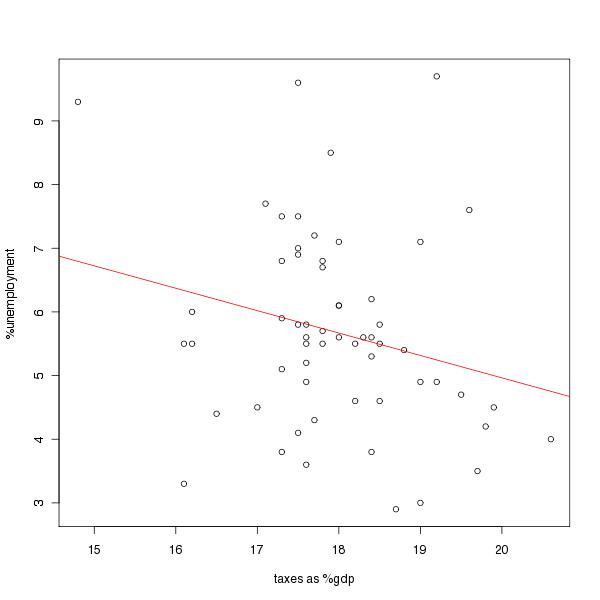
First, however, we can also observe that simultaneous taxes show a slight negative correlation with unemployment. Pearson’s r=-.24 (linear regression slope=-.35, intercept=12). Again, the problem is that we’d like to show that LOWER taxes DECREASE unemployment, and the explanation is again that policy generally follows facts, while we need to consider the future effects of such policies. [This problem is quite similar to the cop-criminal dilemma where one might like to show that cops reduce crime, but given the penchant to increase police forces in the face of high crime, it becomes statistically quite difficult.]

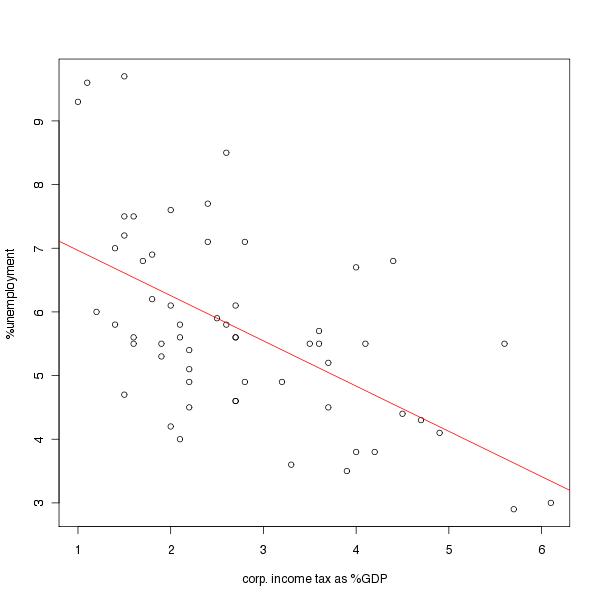
This simultaneous negative correlation is even stronger for corporate taxes in particular. Pearson’s r=-.57 (linear regression slope=-.71, intercept=7.68).

The following table shows yearly percentage changes for the 4 examined variables.

To look for temporal effects, I focused on yearly percentage changes, time-shifted the distributions, and compared their correlations with pearson’s r (which is supposed to be invariant to scale and location changes). Spending’s correlation was calculated with employment (-1*unemployment), while taxes were calculated against unemployment (for the simple convenience of looking for positive correlations in both cases. In fact, pearson’s r manifests this change exactly as a multiple of -1). The following graph restricts itself to a +/-10 year window, and we presumably also want to focus attention on the years where policy preceded outcome (i.e. policy time shift has a negative value).

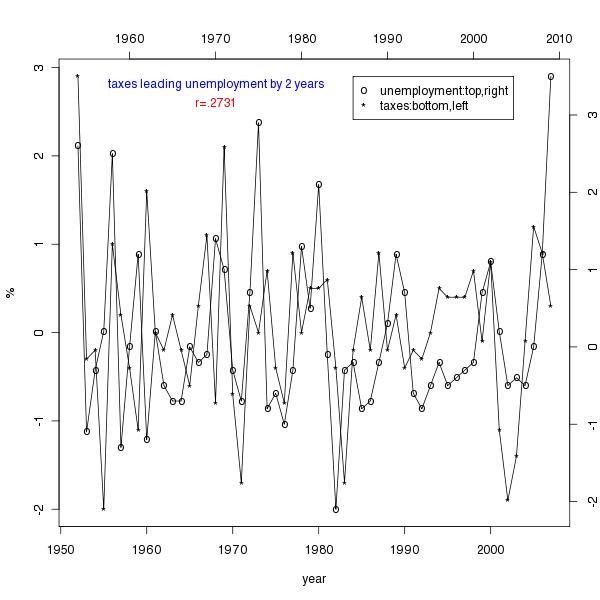
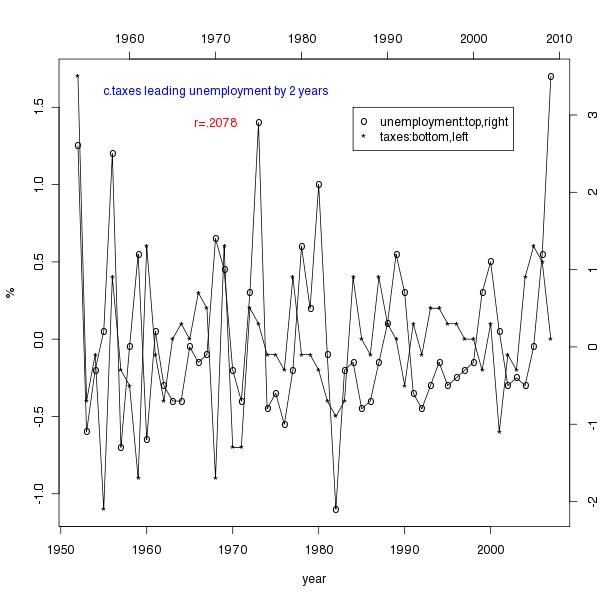
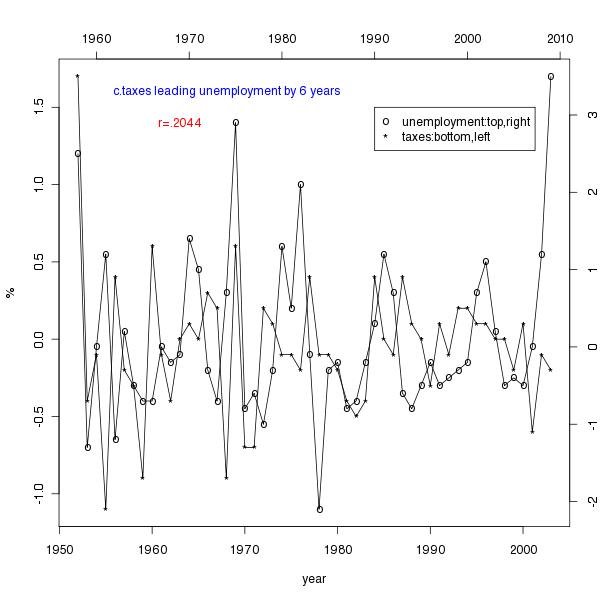
The graph shows the strong negative correlation around year 0, and generally poor correlations overall. The best evidence for any policy effect comes for spending at year -3, for taxes overall at year -2, and for corporate taxes also at year -2 or perhaps -6.

The following graphs show how these time shifts line up.

Though such limited evidence can hardly be considered incredibly persuasive, pearson’s correlation does suggest a more immediate significant role for lowered taxes.

Posted in Uncategorized | Leave a comment

retire?

the following tables helped me consider something i was a little curious about: (ignoring social security) how soon can i retire (if ever)?

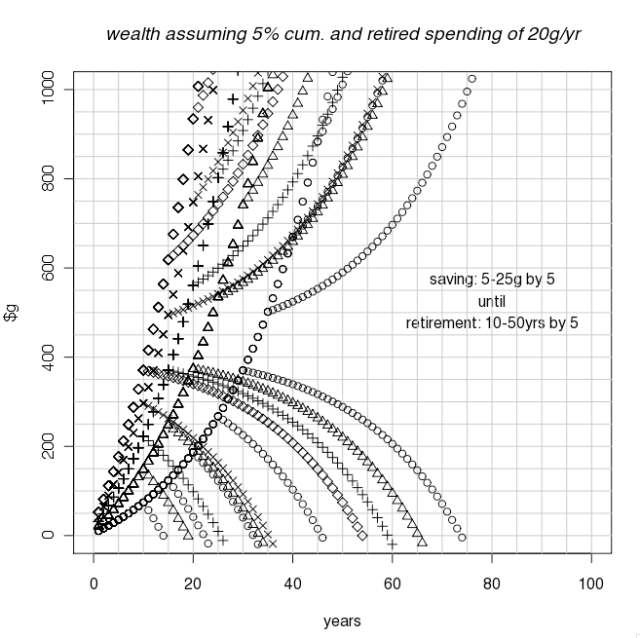
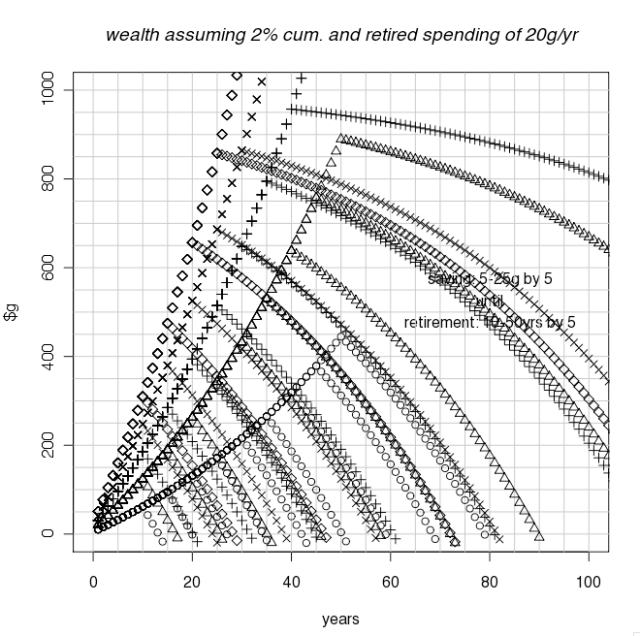
each table assumes a fixed cumulative return rate and fixed yearly expenses “after retirement”. the different shaped dots indicate different savings amounts (from 5g-25g/yr) until retirement, whose effects can be seen veering off the main branches.

for instance, the first table shows that if one saved 5000/yr (the round dots) for 30 years (while seeing a 5% return on their savings), they could save almost 400 grand, and if they only spent 20,000 from then on, their savings would last another 45 years (hitting 0 at year 75; or if you started at 20 years old, and retired at 50, you’d run out at 95). on the other hand, just another 5 years of work (to year 35) would put one’s assumed interest income (from 500g) above the assumed expenses (of 20g) and your wealth would just continue to accumulate without the need for any other income. Saving 20 to 25g/yr, the cumulative effect gives one that little extra boost to surpass the no return point by year 15 (if there was ever anyone who could make enough to save that much but was still willing to live that modestly?).

the next 2 charts show what should perhaps be called more realistic scenarios in these low interest rate climates (though equities have been surging, we are trying to consider a dependable fixed rate fantasy).

if you could get 5g/year into 3% bonds for 50 years, you could live on 30g/year for another 30 years (to year 80; for instance, if you worked from 20 to 70, you’d be ok until 100). and that’s basically the same for 2% returns and 20g/yr retirement expenses.

note that putting 5g/yr into 2-3% returns from age 20 to age 60 (40 years) will not even carry one to 80 years old on 20-30g/yr. Without social security, folks better either save more, work longer, or die younger.

and what about inflation adjustments?

the following graphs present the problem differently: they hold cumulative interest and pre-retirement savings constant, and look at different post-retirement spending options at different retirement years.

For instance, if one saved 10g/year for 20 years, with 3% interest, one could get up to about 300g, and the circles show that spending just 10g/year, one could make it another 70 years to year 90, but the triangles show that spending 20g/year, one would run out in another 20 years, by year 40.

Of course, saving 5g/year, the situation is more dire. If you can save that for 40 years, and live on 10g/year, you’d be set forever, but spending 20g/year, you’d better die by year 70: i.e. work from 20 to 60, and die by 90. actually that doesn’t sound so bad.

Posted in Uncategorized | Leave a comment

convenient charts

check out this javascript page
for quick access to yahoo’s stock charts.


stkchrts

(also linked on the right)

Posted in Uncategorized | Leave a comment

seasons

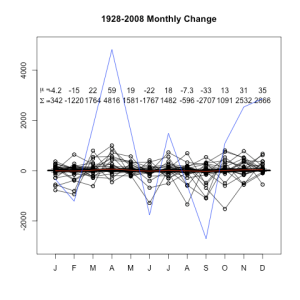
(as might discernible on close inspection, this “YTD” was actually done fairly early in the year, in fact in 2009. whether the suggestions of more volatile mondays (though that one surge could just be an outlier), or more negative mondays and positive wednesdays have any stable predictiveness is hardly established.)
In fact, if I remember correctly, none of these charts pass an ANOVA test for significance on their categories, thus giving credence to the claims of those analysts who suggest that such factors should not be considered influential.

Posted in Uncategorized | Leave a comment

exflation

original: June 9, 2010

i feel a lil goofy realizing that i was previously mostly thinking about exchange rates and trade in a rather complex derivative way and not really apprehending the simple direct way in which exporters benefit from inflation, that is the loss of value of one’s own money.

put from the opposite perspective, a strong currency hurts exporter profits for either of the following reasons:

previously i reasoned that deflation made one’s products more expensive for foreign buyers so they would be forced to buy less. but more directly, if one could sell a pound of rice on the international market for $1usd, then when a dollar bought 40 baht, thai rice exporters made 33% more than when a dollar could only buy 30 baht. it remains unclear how much rice export prices influenced the spring 2010 occupation of bangkok, but that was the fact of the preceding currency shifts (even if my rice price estimate is a bit cavalier).

the former reasoning assumes a certain cost-demand logic and is derivative in the sense that it is predicting certain changes. the latter reasoning is direct in the sense that the effect is immediate without any other change than the currency valuation.

so a plunging currency has to be good for exporters whether foreign sales change or not. profits go up either because they get more money per sale or because a discounted price can produce the same profit per item while presumably selling more. the only way for the exporter to lose would be because other factors could cut sales, like if their export market currencies were deflating due to recession and undergoing serious belt-tightening, as the US has, or because their profits didn’t keep up with that inflation, like especially if much of their costs also came from imported items!

in any case, this whole european disaster should actually be good for any european companies exporting to america or asia, no? (well, where is BMW getting its steel from? though presumably germany is one of the stronger euro economies. hmm, what’s a good french or spanish car company or something else like that?)

in addition, i wish i could get my head around how interest rates and bond prices interact with currency values.

(addendum)

it was a bit ironic how my last post appeared right before people started insisting china was going to allow some deflation, especially to cool their overheating economy, and that post also missed mentioning how pathetically codependent i find both chinese and american dependence on t-bills, but obviously with the euro sinking, who would be silly enough to try to push an international currency now?

in fact, it’s also embarrassing that i actually earlier suggested that a contrarian ought to be hopeful for euros, though that comment was a bit tongue in cheek. still, together these comments could be taken to show how much i can be trusted. then again, maybe NOW would be the right time for a euro investment?

Posted in Uncategorized | Leave a comment

control economies

original: April 7, 2010

i just want to point out that a chinese dollar, aka yuan, aka renminbi, moved from about 8:$1US in 2007 to about 7:$1US in 2009. That’s more than 10% accumulation, right? (making it easier for them to buy our stuff, and harder to sell stuff to us; keep in mind, seems like most economists want to promote out export industries by reducing the worth of our money compared to theirs, while they are trying to keep their money worthless compared to ours so they can keep selling us so much stuff for so cheap because at least it keeps them employed… i wish i was just making this up in some sci-fi social criticism fantasy… remind me again why we don’t live in a world where all countries want their money (and by extension, hours of labor, at least when buying imports) to be worth the most???)

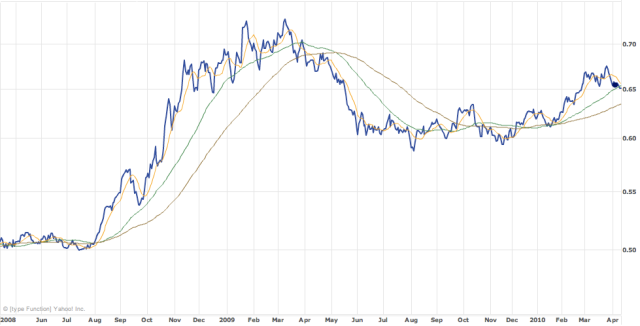
in 2006, $1US peaked at .85euros, dropped until July 2008 to .65euros (about where the charts below start), rose back to .8euros until October, while the US markets slacked, jumping with the final cliff drop(s) of the stock markets, (bouncing before) dropping while they surged, and now surging while they surge. Sorry if that seems unclear, but i’ve been trying to reclarify for myself if there is any correlation. Did the last 2 years hit all 4 logical possibilities of TT,TF,FT,FF?

x-axis:4/08-4/10
y-axis:.62-.80
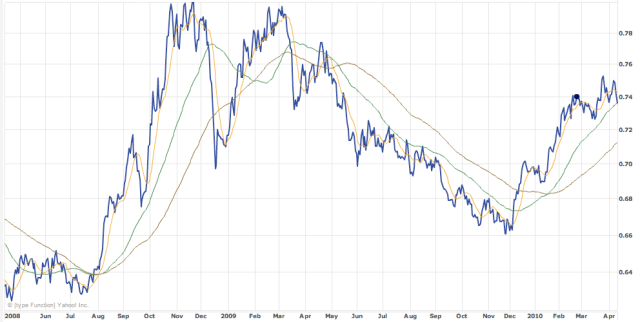
x-axis:4/08-4/10
y-axis:6k-14k

Oh wait, I think we’re only missing down and down. Which I suppose should mean that a contrarian would want to buy euros?

usd/eur djia time
up down 2008q2-3
down up 2009
up up 2010q1

or at least last spring, trying to make sense out of what was happening, i read a number of traditional economic summaries on the inverse relationship of inflation and unemployment. how can prices go up when people don’t have jobs? on the other hand, when there’s more money around, each piece of it has to be worth less, right? So it seemed reasonable that the dollar bounced during the worst drops of 2008-09, and then sagged as the market recovered since 3/09. some bloggers had been referring to the dollar as a “safe haven”, but that logic can seem a little backwards in an economic collapse, and seems unnecessary given the basic supply-demand logic above. though i suppose i would be in error to exclude any of these highly inter-related factors in such a psychological game.

the same reasoning basically applies to gold. if its value was primarily that of a safe haven, we’d expect moves inverse to the market, assuming more people will try to hide in safe havens during bad times. In fact, 11/08-4/09 seems to show that sort of pattern. however, since then, at least until this year, gld has seemed to follow the same basic money supply-demand logic: prices rise as the dollar loses value (looking at the euro below). but this year, the market, gld, eur/usd have all been rising together! could have something to do with EU debt woes. of course, considering the pound and the yen complicates things a bit (their 2-year charts are inserted at the end, for reference, though I am gonna have to figure out something about this piss poor resolution).

x-axis:4/08-4/10
y-axis:-50%-+40%

from yahoo finance (blue=usd/eur, red=djia, green=gld)

anyways, a dollar is currently near .75euros, so skipping the wild swings in the middle, it’s near the same change as the yuan (in the opposite direction). if china is keeping the value of its yuan artificially low, it’s pretty much also keeping the value of a USD artificially high. are china bashers implying that 10% losses in the value of the dollar aren’t good enough? would they like to see us lose 20, 30, 50%? and presumably that would look great on stock market numbers, but what good would the dow breaking 20,000 be, if it took a wheel barrow of money to buy a loaf of bread?

at least we climbed .5 to .65 against the GBP from summer 2008 to the start of 2009.

since 2007, the USD has dropped from 120 to 90 JPY, which is a damn lot, and apparently what we want from the Chinese too, except isn’t that just because the japanese economy hasn’t seen growth for some 20 years. (i’d like to think that shouldn’t even be a problem since they’ve renounced the excessive fertility of undeveloped countries).

anyways, i’m just sick of hearing supposedly “liberal” economists like krugman jumping on this china bashing band wagon, as if 20% swings in the values of a major economy’s currency within a year’s time were something desirable, and that a 10% accumulation in value over a couple of years wasn’t an intelligent strategy. I was planning to bash stiglitz on this too, but surfing his recent comments brings up a lot of “china is doing the right thing” hits. no shit. if this is their strategy, i just hope our leaders are coming up with something more sophisticated than blaming them for our stupidity. shit, when did we trade strategies?

of course, that’s said little about the gap between the rich and the poor, and i will try to look into some more data about how that’s changed in various regions over the last few years. we talk about inflation or deflation, just as population increases and decreases, since anything but stability is bad, since even if stability is bad, instability is usually worse.

—–

jpy/usd:04/08-04/10

gbp/usd:04/08-04/10
actually the real problem with all these comparisons is that though i just read an article the other day claiming that these were the only currencies even relatively secure enough to be considered candidates for international trade, it’s not just the euro that’s plagued by phobias about lazy mediterraneans or the dollar propped by rich asians who don’t know what else to do with their money; the economies of japan and britain already had leaky reputations and were practically on life support before the global fiasco of the gambling bank bailouts even began. still it’s really hard to tell if there’s actually a problem because in many cases the currencies are gaining value but to read the capitalist blogs, they’d rather hear about rampant inflation at least insofar as that can be counted as “economic growth”.

Posted in Uncategorized | Leave a comment

too many lawyers or frivolous suits?

originally: March 26, 2010

Well, I’m loathe to again be taking the side of some major multinational, and it’s not like I’m not afraid of sounding like some crotchity old grandpa, and I’m even afraid that tort reform just means better protection for irresponsible business practices, but this sort of investor litigation seriously seems to be another feather in the cap of this generation’s ongoing evasion of personal responsibility.

Toyota shareholders sue over fallen stock price

Like what would these investors be saying if Toyota wasn’t trying to cover up its problems and were instead just admitting that they sold deficient products? Is that what they want?

But the more shocking facts are in the details:

“U.S-listed shares rose from just over $75 on Oct. 5, the day of the floor mat recall, to above $90 on Jan. 21, when Toyota announced another recall — over gas pedals it says can stick in certain conditions…
After that, the stock price fell, dropping 16 percent as of early March. Shares have since rebounded somewhat, closing Thursday on the New York Stock Exchange at $79.34, but some investors say the recovery did not prevent them from losing potentially millions of dollars as the stock was dropping.”

What is wrong with this market? Are the people who drive this market doing any research at all? Problems were known, recalls started, and the stock rises 20%!!! (Over approximately the same period, the DJIA rose 10%, plunging steeply after Jan. 19; also as of Mar. 26, 2010, NYSE:TM is over $80).

And the one material disclosure given in the article is the guy who bought 40 shares! So he spent $3-3.6 thousand dollars and lost at most $600. Is he hoping to sue for pain and suffering too? I guess his lawyers must be friends or doing some kind of pro bono work.

It reminds me of a letter that Discover sent out last year stating that a class action lawsuit had been settled because of some customer information that they had inappropriately released. All the cardholders residing in California got a few months of identity theft insurance, the initiators of the suit got a few thousand dollars and the lawyers got over $3 MILLION!

Again, I fear that tort reform is just a distraction from making life affordable for little guys, and it certainly would seem that the rule of law is a precondition for general benefits of technological development, but with this sort of friviality clogging up the courts, it’s hard not to seem like the world could be a bit better off with a lot less lawyers.

Posted in Uncategorized | Leave a comment

microsoft vs. att, 2007

originally: Feb. 26, 2010

the recent flurry of

tech patent lawsuits

and the unsettling trend of

corporations paying microsoft
to use FOSS-protected linux

led to considering the dual supreme court rulingson patents in April of 2007, both rejecting claims of infringement.

microsoft vs. att
ksr vs. teleflex

While I would like to support restricted patent validity,
insofar as claims of patents promoting innovation seem oblivious
to the blatant ways in which they necessarily discourage it,
the ruling in the case of AT&T’s speech software patent
is shocking in its apparent radical implications.

1. “(master)copies” aren’t “components”, and thus continue to circumvent the congressional attempt, 271(f), to prevent American corporations from circumventing American patent law, by simply moving patent-infringing assembly abroad.
2. Infringement occurs at the “object code” stage, not at the “source code” stage.
3. btw, American patent law has no jurisdiction in foreign countries (even for 2 American companies).

Microsoft admits that its code, installed on American computers, violates AT&T’s speech technology patents in the US, and has accepted its responsibility to pay damages for this distribution in the US, but not for any distribution of its infringing products abroad.

Generally, AT&T could not collect for foreign infringements in an American court, but 35 U. S. C. sec. 271(f), specifically provides that infringement does occur when a US company provides a patented invention’s components for “combination” abroad. Remarkably, Microsoft successfully argued that its software was not a component that combined with hardware to result in a product that violated AT&T’s patented speech technology (though it did if it was combined in the US?).

If Microsoft selling their infringing product to some unregulated market, doesn’t infringe on AT&T’s patent, then does anybody selling that product infringe on any of Microsoft’s patents?

I wonder what markets, if any, Microsoft products aren’t protected in.

I also wonder why AT&T can’t acquire acknowledgment of its pre-existing (American) patent, in whatever relevant international markets. (In other words, what are the conventions for international acknowledgment of whatever patent protections?)

But if copies simply aren’t components, that it hardly even seems to matter the jurisdiction, for whoever ships them anywhere, or sells them to anyone.

Then the infringement should only adhere to the installer of software, who is only subject to his home jurisdiction. (So is Microsoft just telling AT&T to go chase after all its customers?)

It may be obvious that i’m more than a lil confused,
how the justices intended all these disparate issues to interrelate,
in that the questions of components, combination, assembly,
and the scope of American law are tangled issues that
conspire together to evade any legal relevance.
In any case, it is not a little surprising to see a corporation like Microsoft
actually undermining patent validity on technicalities at the intersection
of metaphysical identity and source or target jurisdictions,
which in fact teeter towards remarkably
sweeping redefinitions of all software as fundamentally unpatentable.

(on the other hand, what alternative implications arise from
the additional option of application of copyright protections?)

the other case provides a refreshing application
of the “obviousness” invalidation,
and is also striking in its far more detailed attention
to mechanical particulars,
perhaps leading one to again wonder
whether the analogy of a blueprint in the software ruling
may have not derived from an overly superficial understanding
of the kinds of new mediums that technology is providing.

To clarify my own position (sort of),
it seems to me that Microsoft sells components
intended for assembly of a patented invention,
and thus 271(f) should apply,
but if they are correct that software infringement
applies to the assembler instead of the provider,
then shouldn’t that also apply domestically,
thus implying that file-sharing (at least of certain types)
doesn’t break any laws, though file ‘using’ could?

Then again, that apparently wouldn’t do much
for us would-be end-users, since it would seem to place
all the blame on us.

Thus it seems still too much to hope for,
that this really could be a situation
of the court’s understanding a more fundamental social good
of natural laws being beyond legal restraint,
and information flowing as freely as possible.

addendum 1:

Perhaps I’m missing the forest for the trees but doesn’t TRIPS provide for WTO member nations protecting each other’s patents and copyrights?

Does that mean ATT should have petitioned the WTO for compensation, or still just that ATT would have a case in other WTO countries to have their American patent upheld? I suppose it doesn’t mean that American judges can rule against violations in other countries?

question 1:

is there something about the difference of technology and art that justifies patents lasting for approximately 20 years while copyrights last perhaps 70 years after the death of the author?

question 2:

is that difference belied by the fact that computer programs are protected under copyrights?

question 3:

what are “algorithms” protected under?

Posted in Uncategorized | Leave a comment